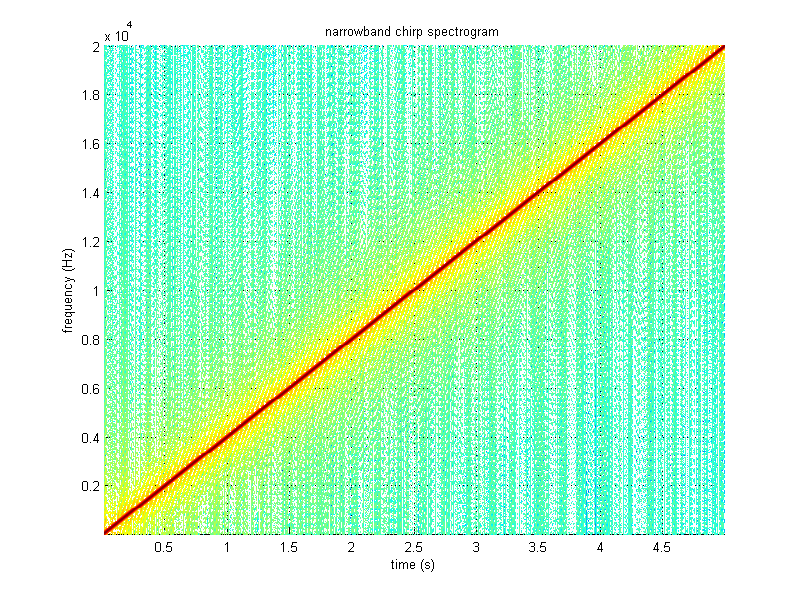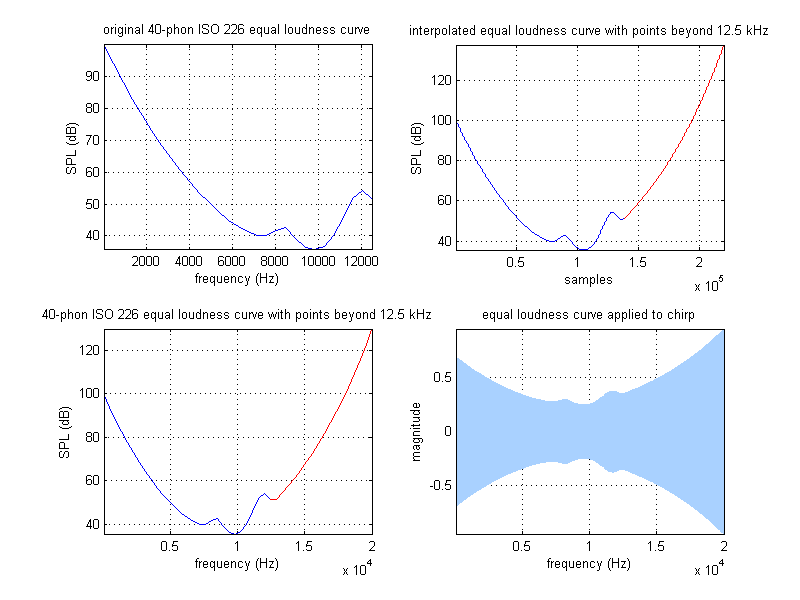

Generate a 5 sec chirp consisting of a tone swept from 20 Hz to 20 kHz at a constant rate and amplitude, assuming an SPL of 20 to 50 dB. Plot the envelope required to maintain constant loudness level for this chirp, and generate the equal loudness version of this chirp.
MATLAB has a built-in chirp function that makes generating a chirp pretty easy. The spectrogram shows that it is indeed a linear sweep from 20 Hz to 20 kHz. Applying the equal loudness curve to the signal was a bit trickier. The ISO 226 standard only defines the curve up to 12.5 kHz, which isn't that high. According to this paper, "above 12.5 kHz, equal-loudness-level data are relatively scarce and tend to be very variable." To work around this, I interpolated a couple extra points of data, using a simple log scale (which obviously isn't entirely accurate). Using the curve also required interpolating a large set of values, spaced in between the mere 29 points provided by the ISO 226 standard. At first, I was using the interp function, which was inefficient and slow beyond belief, until I finally figured out how to use the spline function, which is extremely speedy in comparison.
function project_03_part02abc()
close all;

fs = 44100;             %sampling rate
t = 0:1/fs:5;           %time of 5 seconds
chirp_freq_lo = 20;     %start of sweep
chirp_freq_hi = 20000;  %end of sweep
signal = chirp(t,chirp_freq_lo,5,chirp_freq_hi,'linear');

%spectrogram at 500 frequency points is extremely slow..
f = linspace(chirp_freq_lo,chirp_freq_hi,500);
nb_window_size = round(0.0225*fs);
nb_window_overlap = round(nb_window_size*0.97);
%spectrogram(signal,nb_window_size,nb_window_overlap,f,fs,'yaxis'), grid on, axis tight;
%title('narrowband chirp spectrogram'), xlabel('time (s)'), ylabel('frequency (Hz)');
%print project_03_part02a -dpng -r100;

equal_loudness_curve = iso226(40);      %original Fletcher-Munson curve was at 40-phon
orig_elc_freq_min = 20;                 %ISO 226 starts at to 20 Hz
orig_elc_freq_max = 12500;              %ISO 226 goes up to 12.5 kHz
orig_elc_data_pts = 29;                 %ISO 226 gives 29 frequency points
f = linspace(orig_elc_freq_min,orig_elc_freq_max,orig_elc_data_pts);
figure, subplot(221), plot(f,equal_loudness_curve), grid on, axis tight;
title('original 40-phon ISO 226 equal loudness curve'), xlabel('frequency (Hz)'), ylabel('SPL (dB)');

%ISO 226 only goes up to 12.5 kHz and 29 data points, so here, additional values are
%interpolated based on a log scale. The 1.3*(max of the equal loudness curve) scaling
%factor that the right side of the curve now reaches is somewhat arbitary.
if(orig_elc_freq_max < chirp_freq_hi)
    extra_pts = round(orig_elc_data_pts*chirp_freq_hi/orig_elc_freq_max) - orig_elc_data_pts;
    orig_elc_length = length(equal_loudness_curve);
    extra_values = logspace(log(equal_loudness_curve(length(equal_loudness_curve)))/log(10),...
        log(1.3*max(equal_loudness_curve))/log(10),extra_pts);
    equal_loudness_curve = [equal_loudness_curve,extra_values];
end

f = linspace(orig_elc_freq_min,chirp_freq_hi,orig_elc_data_pts+extra_pts);
subplot(223), plot(f,equal_loudness_curve,'b',f(orig_elc_length:length(equal_loudness_curve)),...
    equal_loudness_curve(orig_elc_length:length(equal_loudness_curve)),'r'), grid on, axis tight;
title('40-phon ISO 226 equal loudness curve with points beyond 12.5 kHz'), xlabel('frequency (Hz)'), ylabel('SPL (dB)');

elc_interp = spline(0:length(equal_loudness_curve)-1,equal_loudness_curve,...
    0:length(equal_loudness_curve)/(length(signal)-1):length(equal_loudness_curve));

orig_elc_length_scaled = orig_elc_length*(1/(length(equal_loudness_curve)/(length(signal)-1)));
subplot(222), plot(1:length(elc_interp),elc_interp,'b',...
    orig_elc_length_scaled:length(elc_interp),elc_interp(orig_elc_length_scaled:length(elc_interp)),'r'), grid on, axis tight;
title('interpolated equal loudness curve with points beyond 12.5 kHz'), xlabel('samples'), ylabel('SPL (dB)');

f = linspace(chirp_freq_lo,chirp_freq_hi,length(signal));   %f needs to be same length as signal for plot
envelope = -1*elc_interp;
signal = envelope.*signal;
signal = 0.95*signal./max(abs(signal));      %normalized signal
subplot(224), plot(f,signal), grid on, axis tight;
title('equal loudness curve applied to chirp'), xlabel('frequency (Hz)'), ylabel('magnitude');

soundsc(signal,fs);
wavwrite(signal,fs,'project_03_part02abc');
print project_03_part02bc -dpng -r100;
|
 |
 |