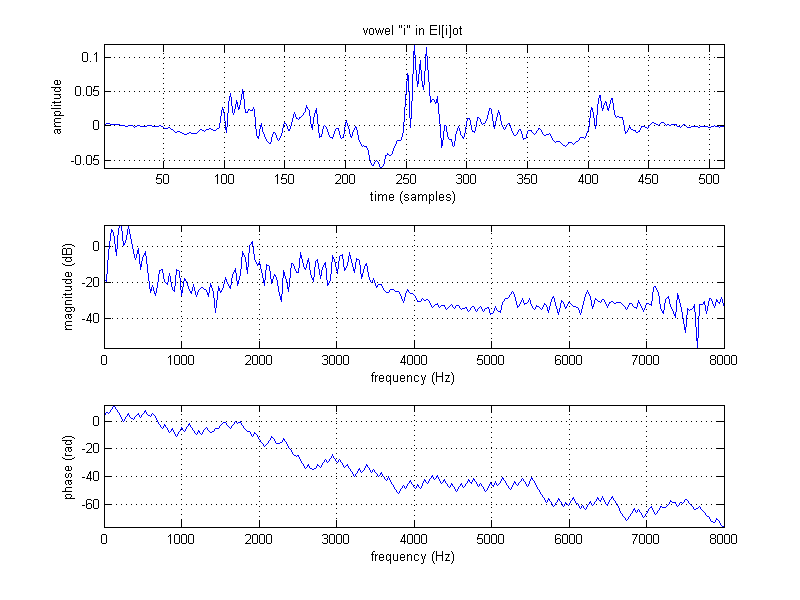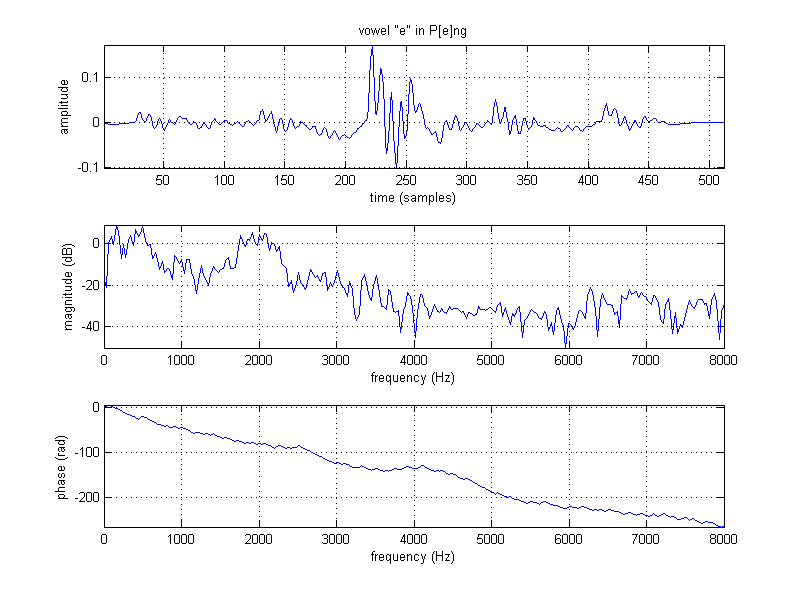

Select two different 30 ms vowel segments in the recorded utterance and plot their magnitude (dB vs. Hz) and phase spectra (radius vs. Hz) spectra, from 0 Hz to fs/2 Hz.
Using both spectrograms from the previous part, I guessed the locations of the various vowels by examining the spectral density and frequency content of the signal. Judging by the frequency graphs, I was fairly close: according to Wikipedia, the first and second formant centers for the 'i' vowel is 320 Hz and 2500 Hz, and 500 Hz and 2300 Hz for the 'e' vowel.
function project_03_part01d()
close all;

[signal,fs,nbits] = wavread('eliot_peng.wav');

segment_length = .03*fs;                    %30 ms
window_size = 2^nextpow2(segment_length);   %# of points in Fourier transform should be power of 2
f = (fs/2)*linspace(0,1,window_size/2);

vowel1_start = 0.3*fs;                      %start of 'i' in El[i]ot
vowel1 = signal(vowel1_start - window_size/2:vowel1_start + window_size/2 - 1);
vowel1 = vowel1.*hamming(window_size);
subplot(311), plot(vowel1), grid on, axis tight;
title('vowel "i" in El[i]ot'), xlabel('time (samples)'), ylabel('amplitude');

magnitude_vowel1 = fft(vowel1);
magnitude_vowel1 = abs(magnitude_vowel1(1:window_size/2));
magnitude_vowel1 = 20*log10(magnitude_vowel1);
subplot(312), plot(f,magnitude_vowel1), grid on, axis tight;
xlabel('frequency (Hz)'), ylabel('magnitude (dB)');

phase_vowel1 = fft(vowel1);
phase_vowel1 = unwrap(angle(phase_vowel1(1:window_size/2)));
subplot(313), plot(f,phase_vowel1), grid on, axis tight;
xlabel('frequency (Hz)'), ylabel('phase (rad)');

%soundsc(vowel1,fs);
%print project_03_part01d_vowel1 -dpng -r100;

vowel2_start = 1.14*fs;                      %start of 'e' in P[e]ng
vowel2 = signal(vowel2_start - window_size/2:vowel2_start + window_size/2 - 1);
vowel2 = vowel2.*hamming(window_size);
figure;
subplot(311), plot(vowel2), grid on, axis tight;
title('vowel "e" in P[e]ng'), xlabel('time (samples)'), ylabel('amplitude');

magnitude_vowel2 = fft(vowel2);
magnitude_vowel2 = abs(magnitude_vowel2(1:window_size/2));
magnitude_vowel2 = 20*log10(magnitude_vowel2);
subplot(312), plot(f,magnitude_vowel2), grid on, axis tight;
xlabel('frequency (Hz)'), ylabel('magnitude (dB)');

phase_vowel2 = fft(vowel2);
phase_vowel2 = unwrap(angle(phase_vowel2(1:window_size/2)));
subplot(313), plot(f,phase_vowel2), grid on, axis tight;
xlabel('frequency (Hz)'), ylabel('phase (rad)');

%soundsc(vowel2,fs);
%print project_03_part01d_vowel2 -dpng -r100;
|
 |
 |