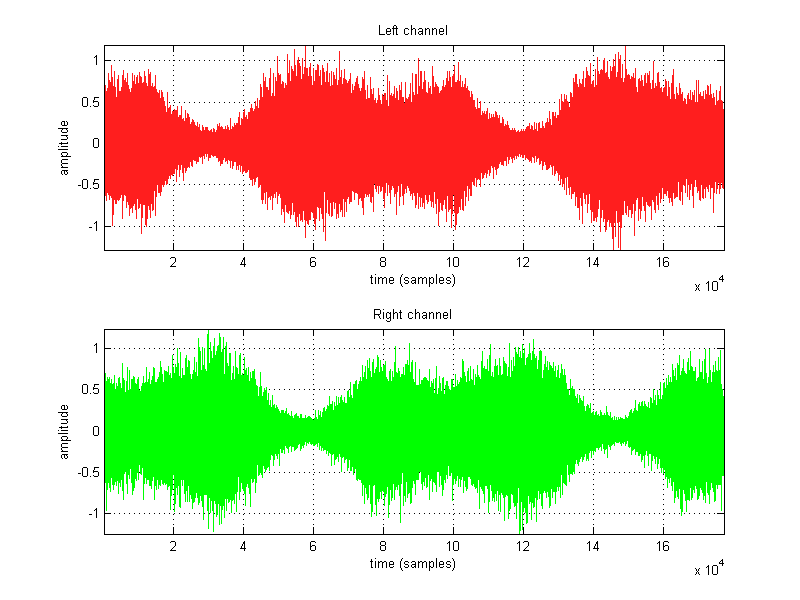
Synthesize 4 seconds of the received binaural signal when both sources described in parts a and b are in operation.
All that needs to be done here is to run the functions coded for parts 01a and 01b, and adding the two signals together for the output. In order to get project_02_part01a() and project_02_part01b() to run here, the variables fs, rotation_time, rotations, and number_of_measurements need to be commented out in their respective M-files. Since the two signals generated may be of different lengths, zeros will be padded to the shorter signal in order to keep the longer signal in its entirety when adding them together.
function project_02_part01c(fs, rotation_time1, rotation_time2, rotations1, rotations2, number_of_measurements)

%comment out fs, rotation_time, rotations, and number_of_measurements to specify values from command line
fs = 44100;                     %sampling rate
rotation_time1 = 2;             %time it takes in seconds for a full rotation
rotation_time2 = 1;             %time it takes in seconds for a full rotation
rotations1 = 2;                 %number of rotations to perform (use whole numbers only!)
rotations2 = 4;                 %number of rotations to perform (use whole numbers only!)
elev = 0;                       %elevation angle remains 0 for this simulation
azim = 0;                       %azimuth angle of 0 = directly in front of observer; positive degrees rotate clockwise
number_of_measurements = 37;    %37 HRTF measurements are provided, from 0 to 180 degrees, in 5 degree increments

signal1 = project_02_part01a(fs,rotation_time1,rotations1,number_of_measurements);
signal2 = project_02_part01b(fs,rotation_time2,rotations2,number_of_measurements);

%pads shorter signal with zeros to make signals the same length
pad_length = abs(length(signal1)-length(signal2));

if length(signal1) > length(signal2)
    signal3 = signal1 + [signal2;zeros(pad_length,2)];
else
    signal3 = [signal1;zeros(pad_length,2)] + signal2;
end

subplot(211), plot(signal3(:,1),'Color',[1,0.12,0.12]), grid on, axis tight;
title('Left channel'), xlabel('time (samples)'), ylabel('amplitude');
subplot(212), plot(signal3(:,2),'g'), grid on, axis tight;
title('Right channel'), xlabel('time (samples)'), ylabel('amplitude');

%double max(max()) needed, because max() on a matrix returns a row vector
signal3 = signal3/max(max(abs(signal3))); %normalizes input

%print project_02_part01c -dpng -r100;
%wavwrite(signal3,fs,'project_02_part01c');

soundsc(signal3,fs);
|
 |