function [signal] = project_01_part04a(f0, fs, secs, velocity, observer_distance)
%comment out f0, fs, secs, velocity, and observer_distance to specify
%values from command line
c = 340; %speed of sound
velocity = 10; %velocity of sound source
f0 = 220; %center frequency of sound
fs = 8000; %sampling frequency
secs = 10; %duration of sound
observer_distance = 0.17; %17 cm is distance between adult human ears
time = -secs/2:1/fs:secs/2;
dist(1,:) = velocity*time-observer_distance/2; %distance to left observer
dist(2,:) = velocity*time+observer_distance/2; %distance to right observer
env = 1./abs(dist);
%since 1/x has vertical asymptotes, limit envelope y-values to 1
%here size(env,1) returns 2 - can run thru entire 2 row matrix this way
for i = 1:size(env,1)*length(env)
if env(i) > 1
env(i) = 1;
end
end
v = zeros(2,length(time));
%here size(v,1) returns 2 - can run thru entire 2 row matrix this way
for i = 1:size(v,1)*length(v)
if dist(i) < 0
v(i) = -velocity;
else
v(i) = velocity;
end
end
f = zeros(2,length(time));
%here size(f,1) returns 2 - can run thru entire 2 row matrix this way
for i = 1:size(f,1)*length(f)
f(i) = f0*(c/(c+v(i)));
end
%sort of complicated way to create the stereo signal..
signal(:,1) = env(1,:).*sin(2*pi*f(1,:).*time);
signal(:,2) = env(2,:).*sin(2*pi*f(2,:).*time);
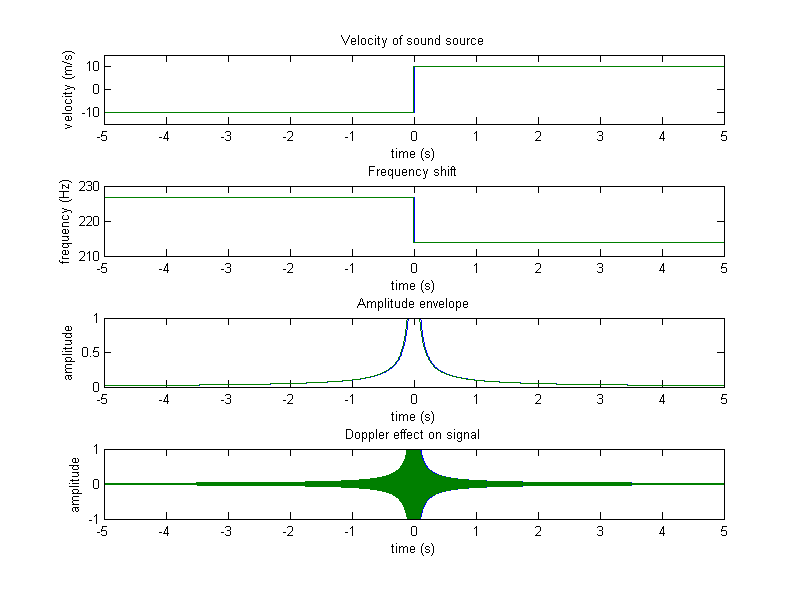
subplot(411), plot(time,v), axis([min(time),max(time),-1.5*velocity,1.5*velocity]);
title('Velocity of sound source'), xlabel('time (s)'), ylabel('velocity (m/s)');
subplot(412), plot(time,f);
title('Frequency shift'), xlabel('time (s)'), ylabel('frequency (Hz)');
subplot(413), plot(time,env);
title('Amplitude envelope'), xlabel('time (s)'), ylabel('amplitude');
subplot(414), plot(time,signal);
title('Doppler effect on signal'), xlabel('time (s)'), ylabel('amplitude');
%double max(max()) needed, because max() on a matrix returns a row vector
signal = signal/max(max(abs(signal)));
%print project_01_part04a -dpng -r100;
%wavwrite(signal,fs,'project_01_part04a');
soundsc(signal,fs);
|