%% calculations
f = [250,500,1000,2000];
k = 2*pi*f/340;     %k = omega/c = wavenumber
Q = 1;              %Q2/Q1 = 1 if in phase, -1 if 180 degrees out of phase
h = 0.35;           %35 cm = size of dipole
P1 = 90;            %P1 = Lw when only one source is active
Lw1 = P1;           %P1 = Lw when only one source is active

radiated_net_power_in_phase = P1*(1 + (Q)^2 + 2*Q*sin(k*h)./(k*h));
radiated_net_power_out_of_phase = P1*(1 + (-Q)^2 + 2*-Q*sin(k*h)./(k*h));

Lw_in_phase = Lw1 + 10*log10(2 + sin(k*h)./(k*h));
Lw_out_of_phase = Lw1 + 10*log10(2 - sin(k*h)./(k*h));

% not very sure about what this equation means, since the values in pascals
% seem way too high to be correct..but it uses the angle of elevation..
thetaN = 30*pi/180; %30 degrees elevation
pressure_in_phase = abs(P1*(1 + Q*exp(j*k*h*sin(thetaN))));
pressure_out_of_phase = abs(P1*(1 + -Q*exp(j*k*h*sin(thetaN))));

r = 10;             %distance of 10 m
Lp_in_phase = Lw_in_phase - 20*log10(r) - 11;
Lp_out_of_phase = Lw_out_of_phase - 20*log10(r) - 11;

% not sure whether this calculated pressure is the correct one, versus
% above calculations involving the angle of elevation
P0 = 2e-5;
P_in_phase = P0*10.^(Lp_in_phase/20);
P_out_of_phase = P0*10.^(Lp_out_of_phase/20);

%% graphs
f_graph = 0:3000;   %frequency sweep from 0 to 3000 Hz
k_graph = 2*pi*f_graph/340;

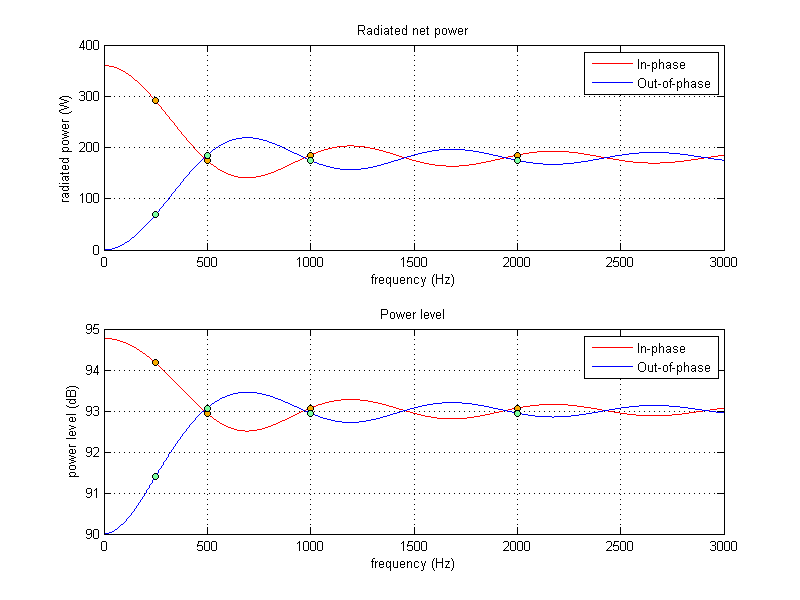
subplot(211), plot(f_graph,P1*(1 + (Q)^2 + 2*Q*sin(k_graph*h)./(k_graph*h)),'r'), grid on;
hold on;
subplot(211), plot(f_graph,P1*(1 + (-Q)^2 + 2*-Q*sin(k_graph*h)./(k_graph*h)),'b'), grid on;
subplot(211), plot(f,radiated_net_power_in_phase,'om','MarkerEdgeColor','k','MarkerFaceColor',[0.98,.68,0],'MarkerSize',5), grid on;
subplot(211), plot(f,radiated_net_power_out_of_phase,'om','MarkerEdgeColor','k','MarkerFaceColor',[.49 1 .63],'MarkerSize',5), grid on;
title('Radiated net power'), xlabel('frequency (Hz)'), ylabel('radiated power (W)');
legend('In-phase','Out-of-phase');

subplot(212), plot(f_graph,Lw1 + 10*log10(2 + sin(k_graph*h)./(k_graph*h)),'r'), grid on;
hold on;
subplot(212), plot(f_graph,Lw1 + 10*log10(2 - sin(k_graph*h)./(k_graph*h)),'b'), grid on;
subplot(212), plot(f,Lw_in_phase,'om','MarkerEdgeColor','k','MarkerFaceColor',[0.98,.68,0],'MarkerSize',5), grid on;
subplot(212), plot(f,Lw_out_of_phase,'om','MarkerEdgeColor','k','MarkerFaceColor',[.49 1 .63],'MarkerSize',5), grid on;
title('Power level'), xlabel('frequency (Hz)'), ylabel('power level (dB)');
legend('In-phase','Out-of-phase');

%print hw03_problem_01_plot -dpng -r100;

%% print results
disp('for frequencies:');
disp(sprintf('%10d',f));
disp('1a. two sources have equal and in phase pressure signals:');
disp('radiated net power (W):');
disp(radiated_net_power_in_phase);
disp('power level (dB):');
disp(Lw_in_phase);
disp('sound pressure (Pa):');
disp(P_in_phase);
disp('pressure level (dB):');
disp(Lp_in_phase);
disp('1b. two sources have equal and 180 degree out of phase pressure signals:');
disp('radiated net power (W):');
disp(radiated_net_power_out_of_phase);
disp('power level (dB):');
disp(Lw_out_of_phase);
disp('sound pressure (Pa):');
disp(P_out_of_phase);
disp('pressure level (dB):');
disp(Lp_out_of_phase);
|

