Exercises set Saturday 23rd February 2002
Number 1
(Based on the 8 a.m. exercise)
- Define and observation struct sutiable for the
real weather.dat file. Read the file into memory
as a list of observations.
- Plot a graph (x axis = day of year, y axis = temperature)
showing the highest temperature recorded on each day
as a red line, something like this:
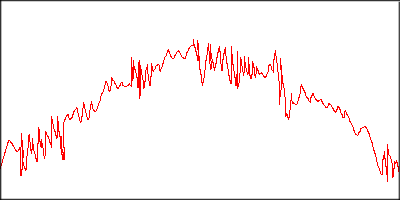
(this is not the real picture)
Initially, just to get it going, you may want to fake the
x axis (pretend each month has 31 days, so x = 31*(month-1)+day.
Make sure you switch to the correct day calculation (allowing for
leap years too, 1999 isn't the only data set) before finishing.
One pixel per day is probbaly ok for the x axis, but you will need
to stretch the y by a factor of 2 or 3 to make it look right.
- Also plot the lowest temperature recorded on each day, in blue, on the
same axes. Be careful not to mix the red and blue lines together; it
is just possible that they may
meet on very rare occasions, but can never cross.
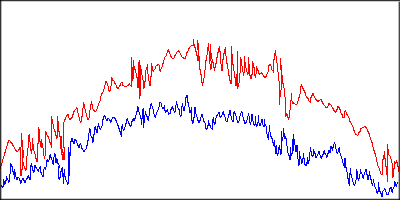
(this is not the real picture)
- Add grid lines showing the divisions between months, and the
temperatures 0, 10, 20, ..., 100, and add labels for human readablility.
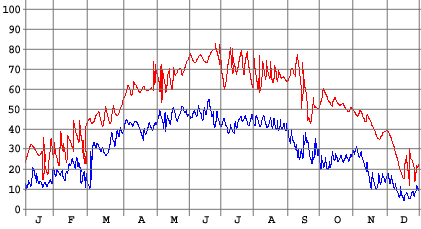
(this is not the real picture)
Hint 1
Remember that scanf and fscanf do not care about
lines of text. If you use them to read the file, make sure that each fscanf
reads exactly the right number of characters to consume one whole line.
Hint 2
An alternate way to tell when you have reached the end of the file
is to use the feof function. Immediately after using any function
that reads from the file (fscanf, fgets, fgetc, etc),
feof will tell you if the previous operation failed because you
were at the end of the file and there was nothing for it to read. feof
takes a single FILE * parameter and returns 1 or 0. e.g.
                    fscanf(fil, "%.....", &......);
                    if (feof(fil))
                      break;
Hint 3
Use an Array to keep all the records read from the file.
If your struct is called observation then this declaration:
observation data[9000];
creates the 'variable' data, making it big enough to hold 9000
observation objects (the file has slightly less than 9000 records in it).
The 9000 individual variables that make up data behave exactly
like normal observation variables would; they are known by their
number (starting from 0), the first is referred to as data[0]
the secons as data[1] and the last as data[8999].
If you have a function read_observation which reads an observation
from the file and returns it as its result, you could read the whole file like this:
                    int number=0;
                    while (1)
                    { data[number]=read_observation(fil);
                      if (feof(fil))
                        break;
                      number+=1; }
Then, if for some reason you wanted to print all the temperatures (all 9000-ish
of them), you could do so without haveing to read from the file ever again, like
this:
                    for (int i=0; i<number; i+=1)
                    { print("temperature in record ");
                      print(i);
                      print(" is ");
                      print(data[i].temp);
                      newline(); }
Number 2
(Easier than it sounds)
Write a program that allows the user to specify a year and month, then using the
graphics library, draws a beautiful calendar for that month, looking something
like this:
| February 2002
|
| Su
| Mo
| Tu
| We
| Th
| Fr
| Sa
|
| | | | |
| 1
| 2
|
| 3
| 4
| 5
| 6
| 7
| 8
| 9
|
| 10
| 11
| 12
| 13
| 14
| 15
| 16
|
| 27
| 28
| 29
| 20
| 21
| 22
| 23
|
| 24
| 25
| 26
| 27
| 28
| |
|
Do not worry about the Julian calenday or any of that nonsense, but
do make it work for any reasonable year.
Number 3
Implement the rational data type (as a struct), providing
the standard arithmetic operations of addition, subtraction,
multiplication, and division, plus the ability to compare two
rationals checking for equality and a<b. These operations
may be implemented as normal functions, as operators, or both.
Test your implementation thoroughly. For example,
print(add(make_rational(1,4), make_rational(1,12)))
is supposed to be adding one quarter and one twelfth, which produces one
third, so it should print
1/3
Number 4
(Based on Number 1)
You should retain from number 1 the array of observations and the
ability to read it from the data file.
- Write a function int get_statistic(int n, observation x)
which returns the 'n'th statistic from observation x. (Each observation consists of
9 statistics: year, month, day, time, temperature, humidity, wind speed, wind direction,
and pressure). So get_statistic(5, data[0]) would retrieve the temperature
from the very first observation (just after midnight on 1st of January).
- Allow the user to select two statistics (by entering two numbers between 1 and 9)
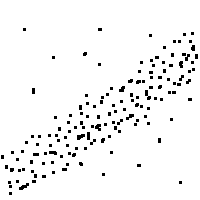
and plot a "scatter-graph" showing how the two statistics are related (if at all): for
every single observation, extract the two statistics, and plot a point on a graph; for the
point's co-ordinates (x,y), x should be the value of the first staistic and y the second.
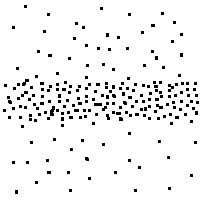
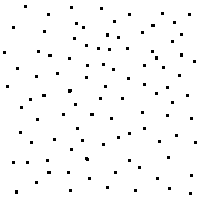
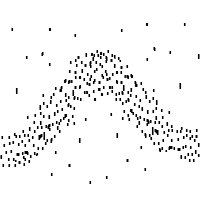
The result will be a rectangle with a lot of dots all over it. If the two statistics
show any correlation you will see that in the pattern of dots; if they don't, the dots
will not show a pattern. For example:
 | | 
|
| Correlation
|
| No Correlation
|
| |
|
|
 | | 
|
| No Correlation
|
| Correlation |
Number 5
(if you have time)
Read the beginning of chapter 4 of the printed notes (pages 101 to 110) and
perform the ecological simulations that it discusses (using realmgraphics rather
than ugly character-based plotting):
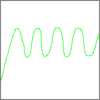
- Plot the simulated population of rabbits with unlimited food.
- Plot the simulated population of rabbits with limited food; experiment
with the birth and death rates and see if you can stable, oscillating,
and chaotic systems.
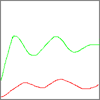
- Add foxes to the second system, plotting the two populations on the same axes
in different colours. (you may need to multiply the number of foxes by some
scaling factor when plotting it, otherwise the variations may seem too small to
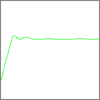
see; there are always far far fewer predators than prey). See if you can
get the behaviours described.
| 
| 
| 
|
| Stable
| Oscillating
| Chaotic
| Hassled
|


