Project 1 - Part 3
Repeat Part 2 with the source consisting of a composition of a 3-tone signal.
Results
MatLab Code
Velocity of object: 25m/s
Distance Traveled: 100m
Distance infront of observer: 75m
Distance behind observer: 25m
Distance of observer from path: 5m
Sounds generated by source: 440Hz, 500Hz, and 550Hz tones
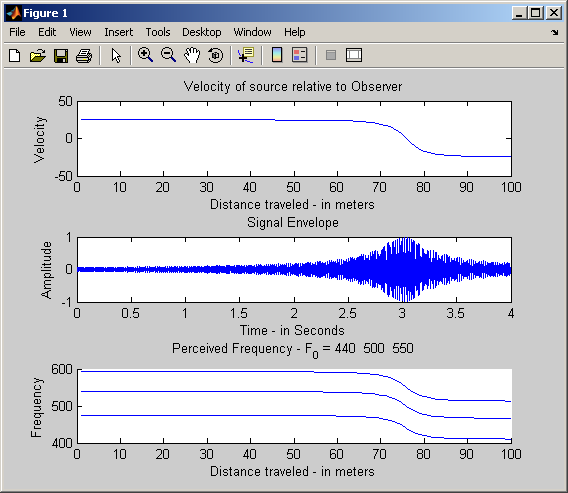
Perceived frequency at the begining:
474.4004 Hz
539.0914 Hz
593.0005 Hz
Perceived frequency at the end:
410.7301 Hz
466.7387 Hz
513.4126 Hz
Perceived Frequency at the closest point:
440 Hz
500 Hz
550 Hz
Sound Clip
Conclusion
As with part two I was unable to get rid of the artifacts in the audio. However, I was able to correctly plot all of the graphs.